IGMIN: We're glad you're here. Please click 'create a new query' if you are a new visitor to our website and need further information from us.
If you are already a member of our network and need to keep track of any developments regarding a question you have already submitted, click 'take me to my Query.'
Welcome to IgMin Research – an Open Access journal uniting Biology, Medicine, and Engineering. We’re dedicated to advancing global knowledge and fostering collaboration across scientific fields.
Welcome to IgMin, a leading platform dedicated to enhancing knowledge dissemination and professional growth across multiple fields of science, technology, and the humanities. We believe in the power of open access, collaboration, and innovation. Our goal is to provide individuals and organizations with the tools they need to succeed in the global knowledge economy.
IgMin Publications Inc., Suite 102, West Hartford, CT - 06110, USA
This research used the calculating method of dry deposition to estimate ammonia (NH3) dry deposition value and evaluate its trend in 5 recent years. The results indicate that NH3 concentration is from 1.5 to 11ppb and sites in Southern Vietnam have higher NH3 gas concentration than Northern Vietnam. The high emitted concentration in September is at the Can Tho site in 2019 and in March at the Ha Noi site in 2023. The 2021 year has the highest NH3 dry deposition with 35.59 kg/ha/ year and the 2023 year has the lowest NH3 dry deposition with 24.4 kg/ha/year. Hoa Binh site has the highest NH3 dry deposition and a strong increase in December 2021. The Can Tho site has high NH3 dry deposition in most of the years from 2019 to 2023. The rural site reveals higher NH3 dry deposition than other sites due to agricultural activities. Medium NH3 dry deposition in 2021 is higher than other years with the biggest gap between years of NH3 dry deposition. The decreasing trend of NH3 dry deposition occurred from 1999 to 2023 and there is a strong increase in 2021, then it is sharp decrease to 2023. The decreasing trend reveals a perfect signal for improving environmental quality in good monitoring with NH3 dry deposition.
Ammonia (NH3) is the most abundant alkaline gas in the atmosphere and it is a major component of total reactive nitrogen [1]. Atmosphere NH3 is mainly derived from agricultural production processes, including fertilizer application in farming and animal waste emissions in animal husbandry [2], which contribute 80%-90% of total NH3 emissions [1]. Other sources of NH3 include industrial processes, vehicular emissions, and volatilization from soils and oceans [1]. Increasing NH3 emissions have a negative influence on the environment, public health, and climate change. Atmospheric deposition contributes significant amounts of nutrients and polluting compounds to natural ecosystems [3].
Atmospheric deposition is one of the serious environmental pollution issues because it is formed in polluted atmospheric conditions due to excessive gas emissions from waste sources. Deposition includes wet and dry deposition, in which wet deposition is collected through rainwater and dry deposition is drawn from the air via monitoring stations. The dry deposition process controls the transfer of pollutants from the atmosphere to the surface [4]. In the dry deposition, substances exist in the gas form or dust particles and they are blown by the wind, then fall to the ground, the trees, and enter the river system. Dry deposition depends so much on wind speed, temperature, humidity, solar radiation, precipitation amount, and cloud cover factors. Dry deposition of N-compounds includes particulate ammonium (NH+4) and nitrate (NO−3) and the gaseous compounds: ammonia (NH3), nitric acid (HNO3), nitrogen dioxide (NO2), nitric oxide (NO), peroxyacetyl nitrate (PAN) and nitrous acid (HNO2) [3].
Deposition monitoring in the air is one of the basic monitoring items of the Acid Deposition Monitoring Network in East Asia (EANET) [5] which includes 13 countries, including Vietnam. Monitoring stations in Vietnam are covered from the North to South of Vietnam whereas dry deposition monitoring includes 5 stations and is monitored frequently with weekly. Origin data is sent to EANET yearly to store and publish on the EANET website. However, publication data have only each year and it has not been revealed a trend of dry deposition in many recent years. Furthermore, the estimation of dry deposition is calculated by multiplying measured concentrations and deposition velocities [6-8] and only focuses on estimating ammonia dry deposition [9] while research about the trend of ammonia dry deposition has not been mentioned yet, especially in many recent years. Therefore, this research estimates ammonia gas dry deposition in 5 recent years and displays the trend of ammonia gas from the 2019-2023 year to understand the changing of ammonia gas dry deposition in 5 years. This research helps planners to develop environmental policies and make plans to reduce gas emissions into the air.
Methodology
Dry acid deposition of gases is more dangerous than wet acid deposition because it is blown by the wind directly affecting human health. To manage dry acid deposition and develop environmental policies, monitoring dry acid deposition is very necessary. Therefore, this study uses the model-based estimation method to estimate ammonia gas dry deposition combined with aerodynamic resistance, quasi-laminar layer resistance, surface resistance parameters, and meteorological factors such as wind speed, temperature, relative humidity, solar radiation, and precipitation based on equation [10,11] as follows:
Whereas:
Fi is the dry deposition of NH3 gas type
Vd is the deposition velocity of NH3 gas type
Ci is the atmospheric concentration of NH3 gas type.
The dry deposition velocity is a function of particle size and wind velocity; the dry deposition velocity increases with decreasing particle diameter in the particle size range of < 0.1 μm. Suitable parameterizations to estimate the deposition velocities of the target species were arranged by Matsuda (2008) [12] fundamentally based on Wesely’s parameterization [11] (Wesely, 1989). The parameterizations were arranged taking into account previous field studies performed in East Asia [12-19]. The fundamental theory of deposition velocity parameterizations was introduced in the texts of Erisman and Draaijers (1995) and Seinfeld and Pandis (1998) [20,21]. From that, deposition velocity Vd is applied by the resistance model [6,22] and considering meteorological factors, deposition surface, and land use [10] to estimate deposition velocity. It is represented by the following equation:
Whereas:
Vd is the deposition velocity
Ra is the aerodynamic resistance
Rb is the quasi-laminar layer resistance
Rc is the surface resistance
The Ra and Rb parameters are calculated by the parameterizations of Erisman and Draaijers [20]. Rc is estimated by the equation of Wesely [11] and Smith [23] including stomal parameter, mesophyll, and surface resistance parameters. Data for wind speed, temperature, relative humidity, solar radiation, and precipitation are surveyed at the monitoring stations and used in calculating Vd.
Total NH3 gas concentration data are collected from monitoring stations and calculated NH3 dry deposition for all of Vietnam. The trend of NH3 dry deposition is presented for 5 years, from 2019 to 2023 year.
Concentration of ammonia gas
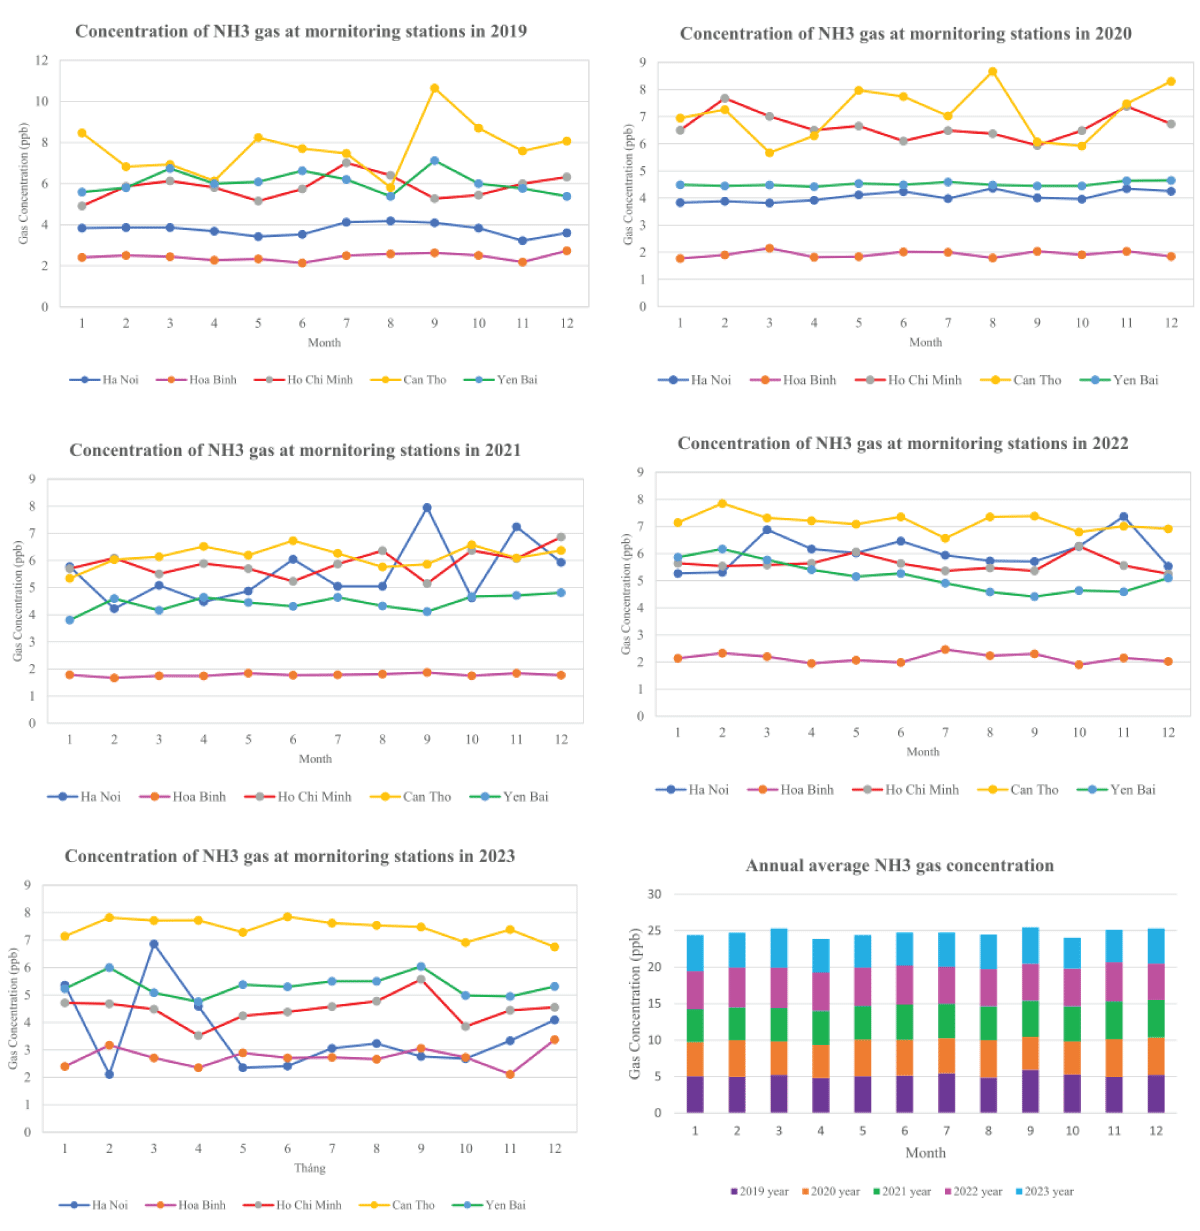
NH3 gas concentration is extracted through monitoring stations from North to South of Vietnam for 5 years and indicates that its concentration is from 1.5 to 11ppb with different years, in which NH3 gas concentration at the Can Tho site has a higher concentration than other sites while Hoa Binh site has the lowest NH3 gas concentration, than Ha Noi site. That indicates that the sites in Southern Vietnam have higher NH3 gas concentration than Northern Vietnam, this significance relates to NH3 gas emission from the decomposition of animal or plant organic components and fertilizer product manufacturers as well as from vaporing sea water, and stations at the South is near sea than stations at the North. Moreover, changes in NH3 gas concentration monthly at the Can Tho site in 2019 and 2020 year and at the Ha Noi site in 2021 and 2023 year are clearer than other sites, especially in September 2019 and August 2020 at the Can Tho site; in September 2021 and March 2023 at the Ha Noi site. This change is impacted by climate and weather conditions including temperature, precipitation, wind speed, humidity, etc. When considering the fluctuation of medium NH3 gas concentration in 5 years present in 2020 is more fluctuating than other years. Thus, NH3 gas emission at sites is high (the highest is 11ppb), and changing of Southern sites monthly is more than in Northern Vietnam. Higher NH3 gas emissions were recorded in Southern Vietnam because it is released mainly from agricultural activities while Southern Vietnam is the biggest agricultural production zone in Vietnam (Figure 1).
Figure 1: Changing of NH3 concentration at stations in Vietnam.
Dry deposition of ammonia gas
According to the calculating equation of dry deposition to estimate NH3 gas dry deposition, high or low NH3 gas dry deposition depends significantly on wind speed, temperature, humidity, solar radiation, precipitation amount, and cloud cover factors. The table below indicates that total national NH3 dry deposition in 5 years was 26.95 kg/ha/2019 year; 26.08 kg/ha/2020 year; 35.59 kg/ha/2021 year; 27.68 kg/ha/2022 year; and 24.4 kg/ha/2023 year. Thus, 2021 year has the highest NH3 dry deposition and 2023 year has the lowest NH3 dry deposition in 5 recent years. High or low dry deposition value depends on deposition velocity and gas concentration, in which wind speed; temperature; and precipitation are more affected by dry deposition because climate is more and more drying, with high dry deposition value. Moreover, estimating NH3 gas dry deposition in each year shows that the Hanoi site has NH3 dry deposition from 3.43 to 6.97 kg/ha/year in 5 years, in which 2021 year has the highest NH3 dry deposition and 2023 year has the lowest NH3 dry deposition. Hoa Binh site presents NH3 dry deposition from 1.97 - 10.86 kg/ha/year with the highest NH3 dry deposition in the 2021 year. Ho Chi Minh site has an NH3 dry deposition value from 4.24 - 5.5 kg/ha/year with a similar NH3 dry deposition value. Next, the Can Tho site has NH3 dry deposition from 6.69 - 7.87 kg/ha/year with a small gap of NH3 dry deposition value each year. However, the NH3 dry deposition value of the Can Tho site is higher than the Ho Chi Minh site from 2019-2023. The final site is Yen Bai with NH3 dry deposition value from 5.86 - 7.53 kg/ha/year (Table 1).
Thus, changing of NH3 dry deposition value at sites monthly reveals the highest NH3 dry deposition at the Hoa Binh site in 2021 year and higher than other sites. However, the rest of the years at the Hoa Binh site present a very low NH3 dry deposition value of about 2.2 kg/ha/year lower than other sites. Furthermore, the high NH3 dry deposition value during 5 years belongs to the Can Tho site with 7.47 kg/ha/year of medium NH3 dry deposition (Table 1).
Table 1: Dry deposition of NH3 gas at stations in Vietnam.
Station/month
1
2
3
4
5
6
7
8
9
10
11
12
Sum
2019
Ha Noi
0.39
0.25
0.57
0.4
0.34
0.43
0.5
0.48
0.47
0.16
0.21
0.32
4.52
Hoa Binh
0.19
0.17
0.21
0.18
0.21
0.22
0.26
0.41
0.28
0.14
0.11
0.15
2.53
Ho Chi Minh
0.17
0.21
0.45
0.46
0.38
0.63
0.77
0.68
0.56
0.11
0.14
0.17
4.74
Can Tho
0.36
0.3
0.57
0.47
0.82
0.92
0.92
0.76
1.38
0.37
0.35
0.43
7.63
Yen Bai
0.41
0.44
0.62
0.62
0.68
0.87
0.86
0.74
0.89
0.51
0.5
0.4
7.53
Station/month
1
2
3
4
5
6
7
8
9
10
11
12
Sum
2020
Ha Noi
0.46
0.29
0.62
0.48
0.54
0.6
0.56
0.66
0.54
0.24
0.2
0.19
5.4
Hoa Binh
0.14
0.13
0.21
0.18
0.15
0.2
0.2
0.2
0.23
0.13
0.11
0.08
1.97
Ho Chi Minh
0.23
0.25
0.54
0.48
0.5
0.7
0.71
0.67
0.65
0.23
0.27
0.27
5.5
Can Tho
0.29
0.29
0.47
0.49
0.69
1.01
0.89
1.06
0.86
0.52
0.34
0.44
7.35
Yen Bai
0.44
0.43
0.52
0.62
0.48
0.58
0.51
0.52
0.65
0.35
0.31
0.45
5.86
Station/month
1
2
3
4
5
6
7
8
9
10
11
12
Sum
2021
Ha Noi
0.32
0.38
0.71
0.61
0.56
0.73
0.69
0.63
1.08
0.6
0.4
0.26
6.97
Hoa Binh
0.93
0.51
0.99
0.28
0.88
1.1
0.91
1.13
0.65
1.15
0.69
1.64
10.86
Ho Chi Minh
0.21
0.23
0.42
0.49
0.5
0.58
0.66
0.71
0.63
0.3
0.31
0.31
5.37
Can Tho
0.28
0.38
0.53
0.59
0.64
0.81
0.81
0.72
0.74
0.41
0.35
0.43
6.69
Yen Bai
0.35
0.54
0.52
0.65
0.44
0.55
0.58
0.56
0.48
0.4
0.41
0.22
5.7
Station/month
1
2
3
4
5
6
7
8
9
10
11
12
Sum
2022
Ha Noi
0.43
0.44
0.68
0.51
0.52
0.78
0.66
0.71
0.59
0.21
0.38
0.19
6.1
Hoa Binh
0.15
0.18
0.21
0.16
0.17
0.2
0.27
0.24
0.26
0.1
0.13
0
2.07
Ho Chi Minh
0.24
0.2
0.44
0.77
0.54
0.65
0.64
0.69
0.62
0.21
0.09
0.13
5.22
Can Tho
0.33
0.35
0.64
0.7
0.77
0.88
0.87
1.01
1.11
0.42
0.44
0.33
7.83
Yen Bai
0.68
0.69
0.65
0.6
0.52
0.61
0.59
0.58
0.51
0.26
0.34
0.44
6.46
Station/month
1
2
3
4
5
6
7
8
9
10
11
12
Sum
2023
Ha Noi
0.23
0.15
0.68
0.42
0.2
0.34
0.4
0.31
0.33
0.07
0.15
0.17
3.43
Hoa Binh
0.11
0.01
0.23
0.21
0.22
0.29
0.28
0.3
0.36
0.01
0.1
0.15
2.26
Ho Chi Minh
0.2
0.18
0.36
0.3
0.36
0.5
0.55
0.57
0.71
0.14
0.17
0.18
4.24
Can Tho
0.34
0.36
0.64
0.65
0.67
0.96
1.08
0.98
1.01
0.44
0.43
0.31
7.87
Yen Bai
0.35
0.58
0.61
0.54
0.49
0.66
0.74
0.73
0.74
0.34
0.41
0.41
6.6
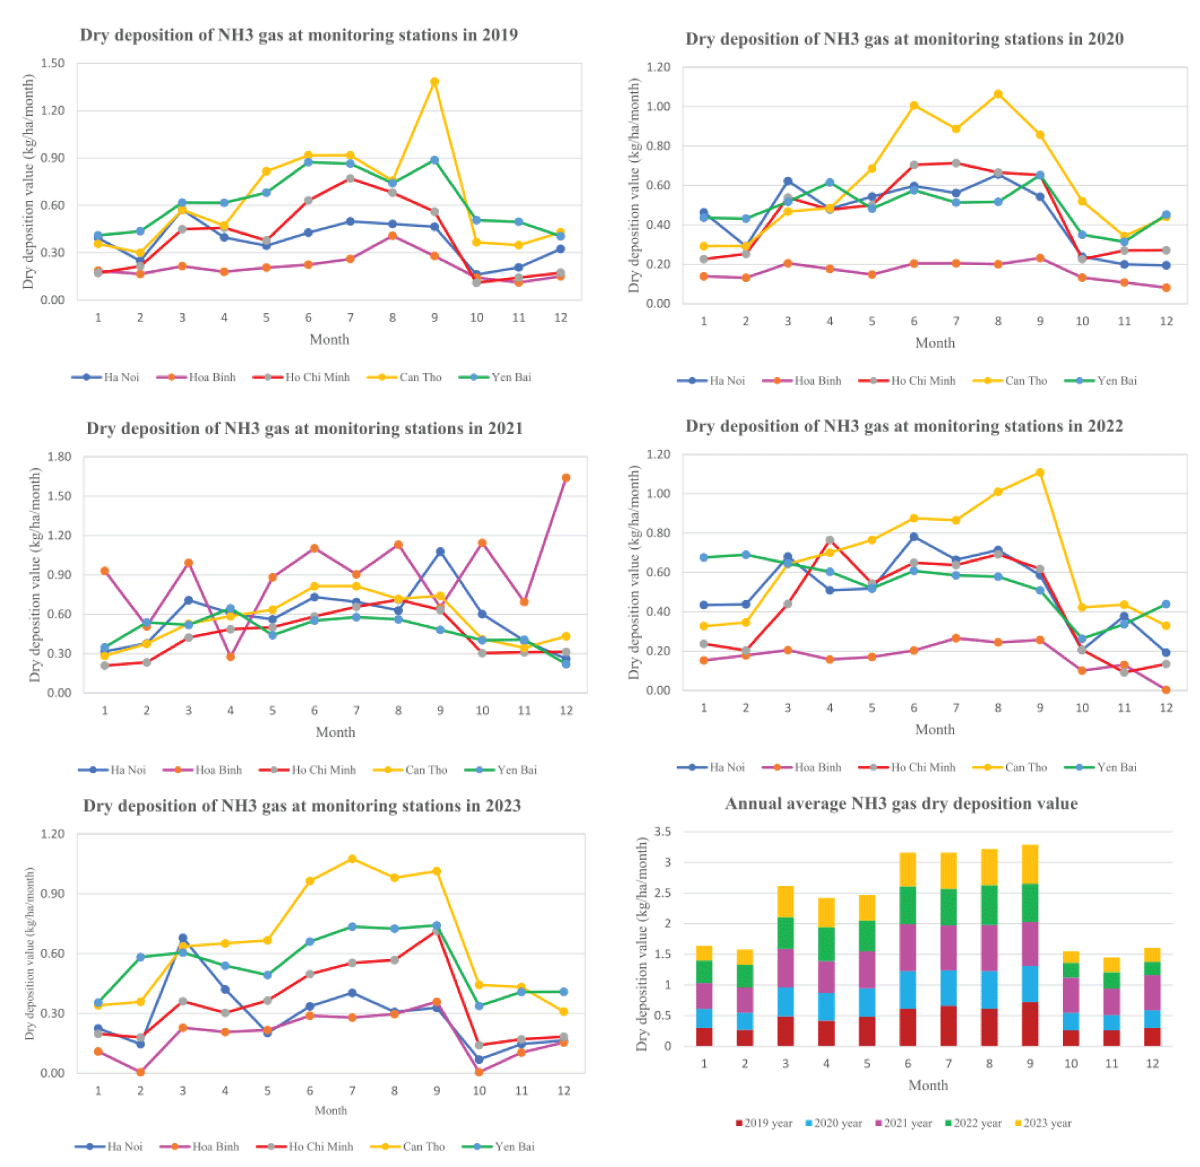
Figure 2 reveals clearly Can Tho site with the yellow line has higher NH3 dry deposition than almost of other sites in years except for 2021 year, while the Hoa Binh site has higher NH3 dry deposition than other sites in the same year (2021 year). When considering monthly NH3 dry deposition revealed that high NH3 dry deposition is from July to September at most of the sites, especially at the Can Tho site. Moreover, Southern and rural sites present normally higher NH3 dry deposition because NH3 emission comes from most agricultural activities (Figure 2).
Figure 2: Changing of NH3 gas dry deposition at stations in Vietnam.
In contrast, urban sites have lower NH3 dry deposition than Ha Noi and Ho Chi Minh sites. NH3 dry deposition value in 12 months indicates that it has changed from 0.51 - 1.64 kg/ha/month at the Hoa Binh site and is the highest NH3 dry deposition, especially in 2021, and strongly increasing in December. NH3 dry deposition of the Can Tho site ranges from 0.31 - 1.08 kg/ha/month and is the highest NH3 dry deposition in the 2023 year. Yen Bai site has NH3 dry deposition from 0.4 - 0.89 kg/ha/month and is the highest NH3 dry deposition in 1999. Ha Noi site is from 0.26 - 1.08 kg/ha/month of NH3 dry deposition value and is the second rank after the Hoa Binh site. The last is the Ho Chi Minh site with similar NH3 dry deposition from 0.2 - 0.71 kg/ha/month. If considering medium NH3 dry deposition, 2021 year has a higher NH3 dry deposition value than other years and the biggest gap in changing of NH3 dry deposition (Figure 2).
Trend of ammonia in 5 years
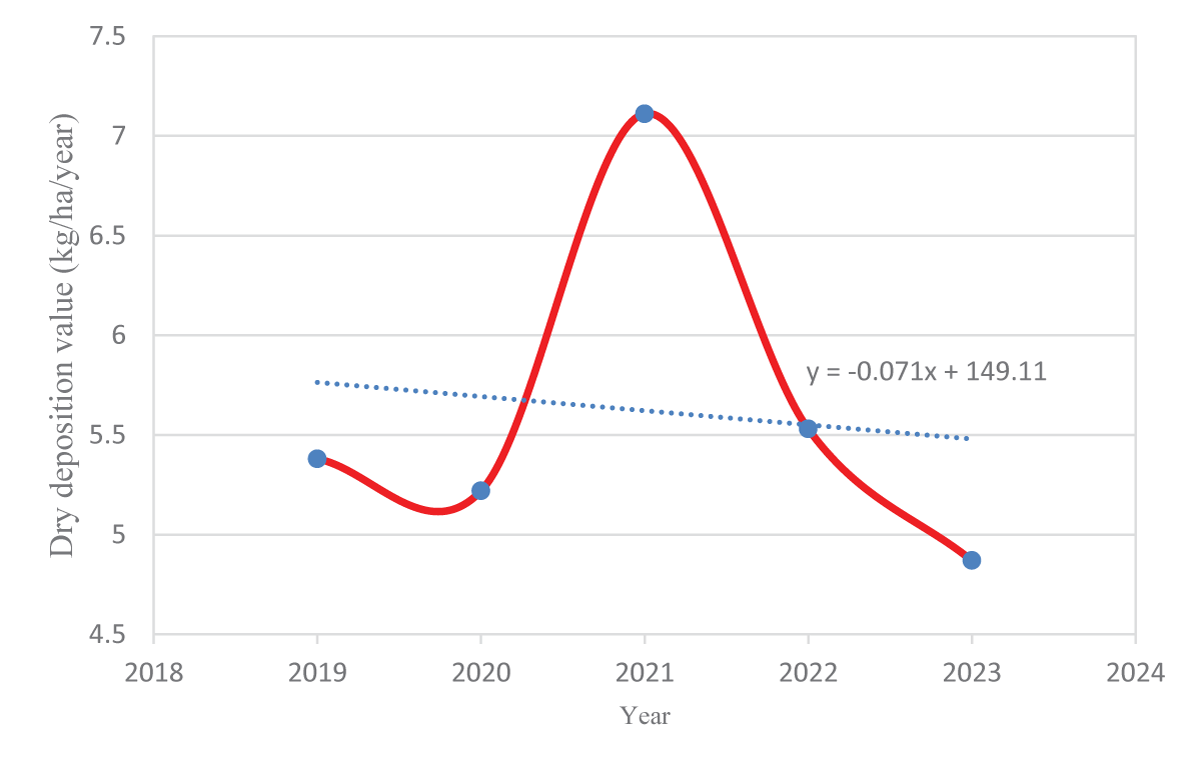
The figure of NH3 dry deposition trend in 5 years shows a decreasing trend of NH3 dry deposition from 1999 to 2023 year. Especially, it is strongly increasing in the 2021 year, and then it is a sharp decrease to the 2023 year. Thus, in general, it is a diminishing trend and with this trend, it predicts that NH3 dry deposition will decrease gradually in the future for all of Vietnam. The decreasing trend reveals that ammonia gas has been managed well in recent years. This significant trend is a good signal for the environment because NH3 emission in the air is controlled and monitored well, it will make a fresher atmosphere and helpful with human health (Figure 3).
Figure 3: Trend of NH3 gas dry deposition in 1999-2023 year.
From determining NH3 emitted concentration via stations in Vietnam and estimating NH3 dry deposition amount in sites, this research drew some significant results as: NH3 concentration is recorded at 1.5 to 11ppb at sites in Southern Vietnam and has higher NH3 gas concentration than Northern Vietnam. The highest emitted concentration in September is at the Can Tho site in the 2019 year and in March at the Ha Noi site in the 2023 year. The 2021 year has the highest NH3 dry deposition with 35.59 kg/ha/ year and the 2023 year has the lowest NH3 dry deposition with 24.4 kg/ha/year. Hoa Binh site has the highest NH3 dry deposition and a strong increase in December of 2021. The Can Tho site has high NH3 dry deposition in most of the years from 2019 to 2023 year. The rural site reveals higher NH3 dry deposition than other sites due to agricultural activities. Medium NH3 dry deposition in 2021 is higher than other years with the biggest gap between years of NH3 dry deposition. The decreasing trend of NH3 dry deposition occurred from 1999 to 2023 year and it had a strong increase in 2021, then a sharp decrease to 2023 year. The decreasing trend reveals a perfect signal for improving environmental quality in good monitoring with NH3 dry deposition.
Behera SN, Sharma M, Aneja VP, Balasubramanian R. Ammonia in the atmosphere: a review on emission sources, atmospheric chemistry and deposition on terrestrial bodies. Environ Sci Pollut Res Int. 2013 Nov;20(11):8092-131. doi: 10.1007/s11356-013-2051-9. Epub 2013 Aug 28. PMID: 23982822.
Yi Y, Shen J, Yang C, Wang J, Li Y, Wu J. Dry deposition of ammonia around paddy fields in the subtropical hilly area in southern China. J Atmos Oceanic Sci Lett. 2020;13(3):216-23.
Andersen HV, Hovmand MF. Review of dry deposition measurements of ammonia and nitric acid to forest. J Forest Ecol Manage. 1999;114(1):5-18.
Giardina P, Buffa G. A new approach for modeling dry deposition velocity of particles. J Atmos Environ. 2018;180:11-22.
EANET (Acid Deposition Monitoring Network in East Asia). Technical Manual for Air Concentration Monitoring in East Asia. 2013:84-114. http://www.eanet.asia/product/manual/techacm.pdf.
EANET (Acid Deposition Monitoring Network in East Asia). Technical Manual on Dry Deposition Flux Estimation in East Asia. 2010:23-26. http://www.eanet.asia/product/manual/techdry.pdf.
Ban S, Matsuda K, Sato K, Ohizumi T. J Atmos Environ. 2016;146:70-78.
Wesely ML, Hicks BB. A review of the current status of knowledge on dry deposition. J Atmos Environ. 2000;34:2261-82.
Liang Y, Jiang H, Liu X. Characteristics of atmospheric ammonia and its impacts on SNA formation PM2.5 of Nanchang, China. J Atmos Pollut Res. 2024;15(4):102059. doi:10.1016/j.apr.2024.102059.
Walcek CJ. A theoretical estimate of O3 and H2O2 dry deposition over the northeast United States. Atmos Environ. 1987;21:1649-59.
Wesley M. Parameterizations of surface resistances to gaseous dry deposition in regional scale numerical models. J Atmos Environ. 1989;23:1293-304.
Matsuda K, Watanabe I, Wingpud V, Theramongkol P, Khummongkol P, Wangwongwatana S, Totsuka T. Ozone dry deposition above a tropical forest in the dry season in northern Thailand. Atmos Environ. 2005;39:2571-7.
Hayashi K, Koga N, Yanai Y. Effects of field-applied composted cattle manure and chemical fertilizer on ammonia and particulate ammonium exchanges at an upland field. Atmos Environ. 2009;43:5702-7.
Matsuda K, Aoki M, Zhang S, Kominami T, Fukuyama T, Fukuzaki N, Totsuka T. Dry deposition velocity of sulfur dioxide on a red pine forest in Nagano, Japan. J Japan Soc Atmos Environ. 2002;37:387-92.
Matsuda K, Watanabe I, Wingpud V, Theramongkol P, Ohizumi T. Deposition velocity of O₃ and SO₂ in the dry and wet season above a tropical forest in northern Thailand. Atmos Environ. 2006;40:7557-64.
Sorimachi A, Sakamoto K, Ishihara H, Fukuyama T, Utiyama M, Liu H, Wang W, Tang D, Dong X, Quan H. Measurements of sulfur dioxide and ozone dry deposition over short vegetation in northern China – a preliminary study. Atmos Environ. 2003;37:3157-66.
Sorimachi A, Sakamoto K, Sakai M, Ishihara H, Fukuyama T, Utiyama M, Liu H, Wang W, Tang D, Dong X, Quan H. Laboratory and field measurements of dry deposition of sulfur dioxide onto Chinese loess surfaces. Environ Sci Technol. 2004 Jun 15;38(12):3396-404. doi: 10.1021/es034967p. PMID: 15260340.
Takahashi A, Sato K, Wakamatsu T, Fujita S, Yoshikawa K. Estimation of dry deposition of sulfur to a forest using an inferential method. J Japan Soc Atmos Environ. 2002;37:192-205.
Takahashi A, Wakamatsu T. Estimation of deposition velocity of particles to a forest using the concentration gradient method. J Japan Soc Atmos Environ. 2004;39:53-61.
Erisman JW, Draaijers GPJ. Atmospheric deposition in relation to acidification and eutrophication. Stud Environ Sci. 1995;63:55-75.
Seinfeld JH, Pandis SN. Atmospheric Chemistry and Physics. Wiley Interscience Publication; 1998. p. 872-3, 971-7.
Matsuda K. Estimation of dry deposition for sulfur and nitrogen compounds in the atmosphere: updated parameterization of deposition velocity. J Japan Soc Atmos Environ. 2008;43:332-9.
Smith RI, Fowler D, Sutton MA, Flechard C, Coyle M. Regional estimation of pollutant gas dry deposition in the UK: model description, sensitivity analyses and outputs. Atmos Environ. 2000;34:3757-77.
Nguyen MT. Ammonia: A Trend of Dry Deposition in Vietnam. IgMin Res. January 30, 2025; 3(1): 070-075. IgMin ID: igmin285; DOI:10.61927/igmin285; Available at: igmin.link/p285
Vietnam Institute of Meteorology, Hydrology and Climate Change, Ministry of Natural Resources and Environment, Vietnam
Address Correspondence: Minh Thu Nguyen, Vietnam Institute of Meteorology, Hydrology and Climate Change, Ministry of Natural Resources and Environment, Vietnam, Email: [email protected]
How to cite this article: Nguyen MT. Ammonia: A Trend of Dry Deposition in Vietnam. IgMin Res. January 30, 2025; 3(1): 070-075. IgMin ID: igmin285; DOI:10.61927/igmin285; Available at: igmin.link/p285
Figure 1: Changing of NH3 concentration at stations in Vietn...
Figure 2: Changing of NH3 gas dry deposition at stations in ...
Figure 3: Trend of NH3 gas dry deposition in 1999-2023 year....
Behera SN, Sharma M, Aneja VP, Balasubramanian R. Ammonia in the atmosphere: a review on emission sources, atmospheric chemistry and deposition on terrestrial bodies. Environ Sci Pollut Res Int. 2013 Nov;20(11):8092-131. doi: 10.1007/s11356-013-2051-9. Epub 2013 Aug 28. PMID: 23982822.
Yi Y, Shen J, Yang C, Wang J, Li Y, Wu J. Dry deposition of ammonia around paddy fields in the subtropical hilly area in southern China. J Atmos Oceanic Sci Lett. 2020;13(3):216-23.
Andersen HV, Hovmand MF. Review of dry deposition measurements of ammonia and nitric acid to forest. J Forest Ecol Manage. 1999;114(1):5-18.
Giardina P, Buffa G. A new approach for modeling dry deposition velocity of particles. J Atmos Environ. 2018;180:11-22.
EANET (Acid Deposition Monitoring Network in East Asia). Technical Manual for Air Concentration Monitoring in East Asia. 2013:84-114. http://www.eanet.asia/product/manual/techacm.pdf.
EANET (Acid Deposition Monitoring Network in East Asia). Technical Manual on Dry Deposition Flux Estimation in East Asia. 2010:23-26. http://www.eanet.asia/product/manual/techdry.pdf.
Ban S, Matsuda K, Sato K, Ohizumi T. J Atmos Environ. 2016;146:70-78.
Wesely ML, Hicks BB. A review of the current status of knowledge on dry deposition. J Atmos Environ. 2000;34:2261-82.
Liang Y, Jiang H, Liu X. Characteristics of atmospheric ammonia and its impacts on SNA formation PM2.5 of Nanchang, China. J Atmos Pollut Res. 2024;15(4):102059. doi:10.1016/j.apr.2024.102059.
Walcek CJ. A theoretical estimate of O3 and H2O2 dry deposition over the northeast United States. Atmos Environ. 1987;21:1649-59.
Wesley M. Parameterizations of surface resistances to gaseous dry deposition in regional scale numerical models. J Atmos Environ. 1989;23:1293-304.
Matsuda K, Watanabe I, Wingpud V, Theramongkol P, Khummongkol P, Wangwongwatana S, Totsuka T. Ozone dry deposition above a tropical forest in the dry season in northern Thailand. Atmos Environ. 2005;39:2571-7.
Hayashi K, Koga N, Yanai Y. Effects of field-applied composted cattle manure and chemical fertilizer on ammonia and particulate ammonium exchanges at an upland field. Atmos Environ. 2009;43:5702-7.
Matsuda K, Aoki M, Zhang S, Kominami T, Fukuyama T, Fukuzaki N, Totsuka T. Dry deposition velocity of sulfur dioxide on a red pine forest in Nagano, Japan. J Japan Soc Atmos Environ. 2002;37:387-92.
Matsuda K, Watanabe I, Wingpud V, Theramongkol P, Ohizumi T. Deposition velocity of O₃ and SO₂ in the dry and wet season above a tropical forest in northern Thailand. Atmos Environ. 2006;40:7557-64.
Sorimachi A, Sakamoto K, Ishihara H, Fukuyama T, Utiyama M, Liu H, Wang W, Tang D, Dong X, Quan H. Measurements of sulfur dioxide and ozone dry deposition over short vegetation in northern China – a preliminary study. Atmos Environ. 2003;37:3157-66.
Sorimachi A, Sakamoto K, Sakai M, Ishihara H, Fukuyama T, Utiyama M, Liu H, Wang W, Tang D, Dong X, Quan H. Laboratory and field measurements of dry deposition of sulfur dioxide onto Chinese loess surfaces. Environ Sci Technol. 2004 Jun 15;38(12):3396-404. doi: 10.1021/es034967p. PMID: 15260340.
Takahashi A, Sato K, Wakamatsu T, Fujita S, Yoshikawa K. Estimation of dry deposition of sulfur to a forest using an inferential method. J Japan Soc Atmos Environ. 2002;37:192-205.
Takahashi A, Wakamatsu T. Estimation of deposition velocity of particles to a forest using the concentration gradient method. J Japan Soc Atmos Environ. 2004;39:53-61.
Erisman JW, Draaijers GPJ. Atmospheric deposition in relation to acidification and eutrophication. Stud Environ Sci. 1995;63:55-75.
Seinfeld JH, Pandis SN. Atmospheric Chemistry and Physics. Wiley Interscience Publication; 1998. p. 872-3, 971-7.
Matsuda K. Estimation of dry deposition for sulfur and nitrogen compounds in the atmosphere: updated parameterization of deposition velocity. J Japan Soc Atmos Environ. 2008;43:332-9.
Smith RI, Fowler D, Sutton MA, Flechard C, Coyle M. Regional estimation of pollutant gas dry deposition in the UK: model description, sensitivity analyses and outputs. Atmos Environ. 2000;34:3757-77.


 Scan and get link